Deep dive into data analysis tools, theory and projects

Category: R programming (Page 2 of 7)

DataScience Portfolio Ideas for Students & Beginners

A lot has been written on the importance of a portfolio if you are looking for a DataScience role. Ideally, you should document your learning journey so that you can reuse code, write well-documented code and also improve your data storytelling skills.

DataScience Portfolio Ideas

However, most students and beginners get stumped on what to include in their portfolio, as their projects are all the same that their classmates, bootcamp associates and seniors have created. So, in this post I am going to tell you what projects you should have in your portfolio kitty, as well as a list of ideas that you can use to construct a collection of projects that will help you stand out on LinkedIn, Github and in the eyes of prospective hiring managers.

Job Search Guide

You can find many interesting projects on the “Projects” page of my website JourneyofAnalytics. I’ve also listed 50+ sources for free datasets in this blogpost.

In this post though, I am classifying projects based on skill level along with sample ideas for DIY projects that you can attempt on your own.

On that note, if you are already looking for a job, or about to do so, do take a look at my book “DataScience Jobs“, available on Amazon. This book will help you reduce your job search time and quickly start a career in analytics.

Since I prefer R over Python, all the project lists in this post will be coded in R. However, feel free to implement these ideas in Python, too!

a. Entry-level / Rookie Stage

  1. If you are just starting out, and are not very comfortable with even syntax, your main aim is to learn how to code along with DataScience concepts. At this stage, just try to write simple scripts in R that can pull data, clean it up and calculate mean/median and create basic exploratory graphs. Pick up any competition dataset on Kaggle.com and look at the highest voted EDA script. Try to recreate it on your own, read through and understand the hows and whys of the code. One excellent example is the Zillow EDA by Philipp Spachtholz.
  2. This will not only teach you the code syntax, but also how to approach a new dataset and slice/dice it to identify meaningful patterns before any analysis can begin.
  3. Once you are comfortable, you can move on to machine learning algorithms. Rather than Titanic, I actually prefer the Housing Prices Dataset. Initially, run the sample submission to establish a baseline score on the leaderboard. Then apply every algorithm you can look up and see how it works on the dataset. This is the fastest way to understand why some algorithms work on numerical target variables versus categorical versus time series.
  4. Next, look at the kernels with decent leaderboard score and replicate them. If you applied those algorithms but did not get the same result, check why there was a mismatch.
  5. Now pick a new dataset and repeat. I prefer competition datasets since you can easily see how your score moves up or down. Sometimes simple decision trees work better than complex Bayesian logic or Xgboost. Experimenting will help you figure out why.

Sample ideas –

  • Survey analysis: Pick up a survey dataset like the Stack overflow developer survey and complete a thorough EDA – men vs women, age and salary correlation, cities with highest salary after factoring in currency differences and cost of living. Can your insights also be converted into an eye-catching Infographic? Can you recreate this?
  • Simple predictions: Apply any algorithms you know on the Google analytics revenue predictor dataset. How do you compare against the baseline sample submission? Against the leaderboard?
  • Automated reporting: Go for end-to-end reporting. Can you automate a simple report, or create a formatted Excel or pdf chart using only R programming? Sample code here.

b. Senior Analyst/Coder

  1. At this stage simple competitions should be easy for you. You dont need to be in the top 1%, even being in the Top 30-40% is good enough. Although, if you can win a competition even better!
  2. Now you can start looking at non-tabular data like NLP sentiment analysis, image classification, API data pulls and even dataset mashup. This is also the stage when you probably feel comfortable enough to start applying for roles, so building unique projects are key.
  3. For sentiment analysis, nothing beats Twitter data, so get the API keys and start pulling data on a topic of interest. You might be limited by the daily pull limits on the free tier, so check if you need 2 accounts and aggregate data over a couple days or even a week. A starter example is the sentiment analysis I did during the Rio Olympics supporting Team USA.
  4. You should also start dabbling in RShiny and automated reports as these will help you in actual jobs where you need to present idea mockups and standardizing weekly/ daily reports.
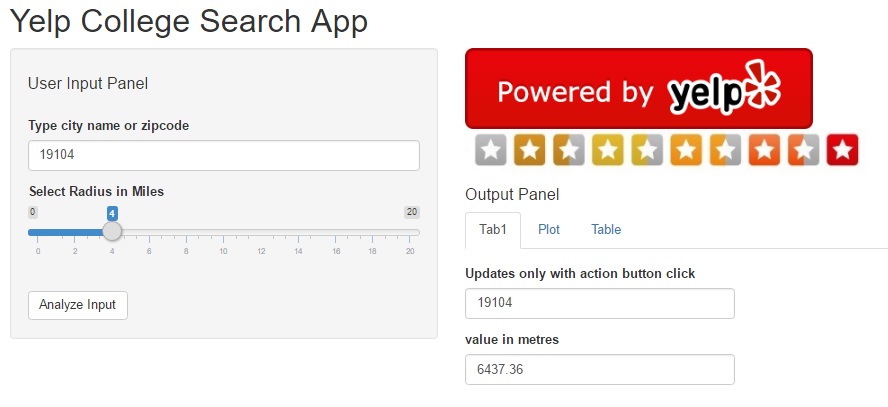
Yelp College Search App

Sample ideas –

  • Twitter Sentiment Analysis: Look at the Twitter sentiments expressed before big IPO launches and see whether the positive or negative feelings correlated with a jump in prices. There are dozens of apps that look at the relation between stock prices and Twitter sentiments, but for this you’d need to be a little more creative since the IPO will not have any historical data to predict the first day dips and peaks.
  • API/RShiny Project: Develop a RShiny dashboard using Yelp API, showing the most popular restaurants around airports. You can combine a public airport dataset and merge it with filtered data from the Yelp API. A similar example (with code) is included in this Yelp College App dashboard.
  • Lyrics Clustering: Try doing some text analytics using song lyrics from this dataset with 50,000+ songs. Do artists repeat their lyrics? Are there common themes across all artists? Do male singers use different words versus female solo tracks? Do bands focus on a totally different theme? If you see your favorite band or lead singer, check how their work has evolved over the years.
  • Image classification starter tutorial is here. Can you customize the code and apply to a different image database?

c. Expert Data Scientist

DataScience Expert portfolio
  1. By now, you should be fairly comfortable with analyzing data from different datasource types (image, text, unstructured), building advanced recommender systems and implementing unsupervised machine learning algorithms. You are now moving from analyze stage to build stage.
  2. You may or may not already have a job by now. If you do, congratulations! Remember to keep learning and coding so you can accelerate your career further.
  3. If you have not, check out my book on how to land a high-paying ($$$) Data Science job job within 90 days.
  4. Look at building Deep learning using keras and apps using artificial intelligence. Even better, can you fully automate your job? No, you wont “downsize” yourself. Instead your employer will happily promote you since you’ve shown them a superb way to improve efficiency and cut costs, and they will love to have you look at other parts of the business where you can repeat the process.

Sample project ideas –

  • Build an App: College recommender system using public datasets and web scraping in R. (Remember to check terms of service as you do not want to violate any laws!) Goal is to recreate a report like the Top 10 cities to live in, but from a college perspective.
  • Start thinking about what data you need – college details (names, locations, majors, size, demographics, cost), outlook (Christian/HBCU/minority), student prospects (salary after graduation, time to graduate, diversity, scholarship, student debt ) , admission process (deadlines, average scores, heavy sports leaning) and so on. How will you aggregate this data? Where will you store it? How can you make it interactive and create an app that people might pay for?
  • Upwork Gigs: Look at Upwork contracts tagged as intermediate or expert, esp. the ones with $500+ budgets. Even if you dont want to bid, just attempt the project on your own. If you fail, you will know you still need to master some more concepts, if you succeed then it will be a superb confidence booster and learning opportunity.
  • Audio Processing: Use the VOX celebrity dataset to identify the speaker based on audio/speech dataset. Audio files are an interesting datasource with applications in customer recognition (think bank call centers to prevent fraud), parsing for customer complaints, etc.
  • Build your own package: Think about the functions and code you use most often. Can you build a package around it? The most trending R-packages are listed here. Can you build something better?

Do you have any other interesting ideas? If so, feel free to contact me with your ideas or send me a link with the Github repo.

Mapping Anthony Bourdain’s Travels

Travel maps tutorial

Anthony Bourdain was an amazing personality – chef, author, world traveler, TV showhost. I loved his shows as much for the exotic locations as for the yummilicious local cuisine. So I was delighted to find a dataset that included all travel location data, from all episodes of his 3 hit TV shows. Dataset attributed to Christine Zhang for publishing the dataset on Github.

In today’s tutorial, we are going to plot this extraordinary person’s world travels in R. So our code will cover geospatial data mapping using 2 methods:

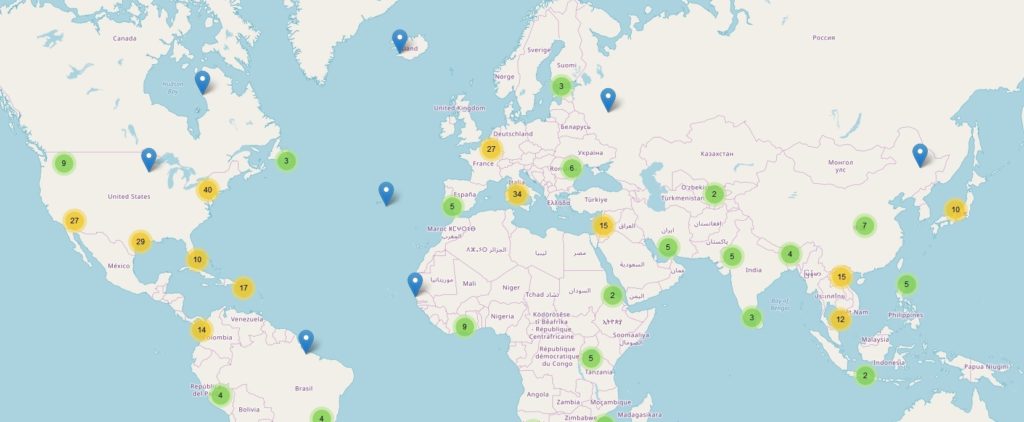
  • Leaflets package to create zoomable maps with markers
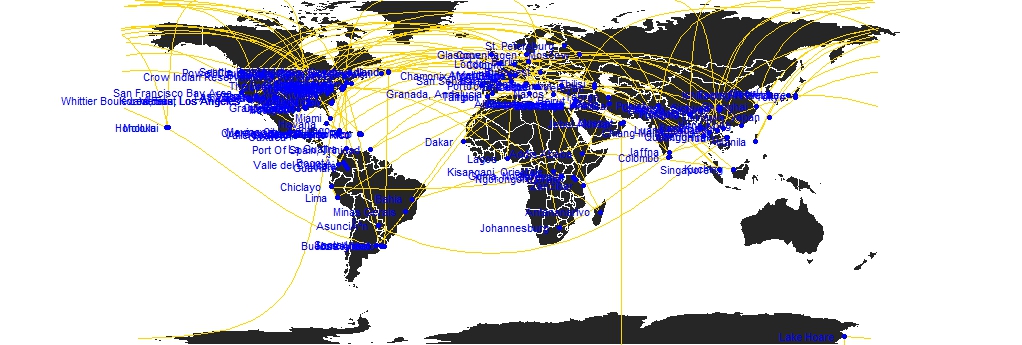
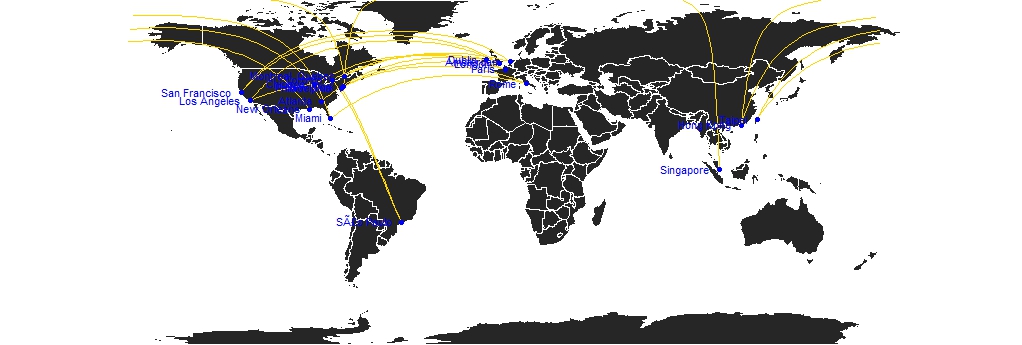
  • Airplane route style maps to see the paths traveled.

Step 1 – Prepare the Workspace

Here we will load all the required library packages, and import the dataset.

places <- data.frame(fread(‘bourdain_travel_places.csv’), stringsAsFactors = F)

Step 2 – Basic Exploration

Our dataset has data for 3 of Bourdain’s shows:

  • No Reservations
  • Parts Unknown – which I personally loved.
  • The Layover

Let us take a sneak peak into the data:

dataset preview

How many countries did Bourdain visit? We can calculate this for the whole dataset or by show:

numshow <- sqldf(“select show , count(distinct(country)) as num_ctry from places group by show”) # Num countries by show.

numctry <- nrow(table(places$country)) # Total countries visited
numstates <- nrow(table(places$state[places$country == ‘United States’])) ## Total states visited in the US.

Wow! Bourdain visited 93 countries overall, and 68 countries for his show “No Reservations”. Talk about world travel.

I did notice some records have state names as countries, for example California, Washington and Massachussets. But these are exceptions, and overall the dataset is extremely clean. Even disregarding those records, 80+ countries is nothing to be scoffed at, and I had never even heard of some of these exotic locations.

P.S.: You know who else gets to travel a lot? Data scientists earning $100k+ per year. Here’s my new book which will help you how to land such a dream job.

Step 3 – Create a Leaflet to View Sites on World Map

Thankfully, the data already has geographical coordinates, so we don’t need to add any processing steps. However, if you have cities which are missing coordinates then use the “worldcities” file from the Projects page under “Rent Analysis”.

We do have some duplicates, where Bourdain visited the same location in 2 or more shows. So we will de-duplicate before plotting.

Next we will add an info column to list the city and state name that we can use on the marker icons.

places4$info <- paste0(places4$city_or_area, “, “, places4$country) # marker icons

mapcity <- leaflet(places4) %>%
setView(2.35, 48.85, zoom = 3) %>%
addTiles() %>%
addMarkers(~long, ~lat, popup = ~info,
options = popupOptions(closeButton = T),
clusterOptions = markerClusterOptions())
mapcity # Show the leaflet

leaflet view – the markers are interactive in R

Step 4 – Flight Route View

Can we plot the cities in flight view style? Yes, we can as long as we transform the dataframe where each record has a departure and arrival city. We do have the show and episode number so this is quite easy.

Once we do that we will use a custom function which basically plots a circle marker at the two cities and a curved line between the two.

plot_my_connection=function( dep_lon, dep_lat, arr_lon, arr_lat, …){
inter <- gcIntermediate(c(dep_lon, dep_lat), c(arr_lon, arr_lat), n=50, addStartEnd=TRUE, breakAtDateLine=F) inter=data.frame(inter) diff_of_lon=abs(dep_lon) + abs(arr_lon) if(diff_of_lon > 180){
lines(subset(inter, lon>=0), …)
lines(subset(inter, lon<0), …)
}else{
lines(inter, …)
}
} # custom function

For the actual map view, we will create a background world map image, then use the custom function in a loop to plot each step of Bourdain’s travels. Depending on how we create the transformed dataframe, we can plot Bourdain’s travels for a single show, single season or all travels.

Here are two maps separately for the show “Parts Unknown” and “The Layover” respectively. Since the former had more seasons, the map is a lot more congested.

Parts Unknown seasons – travel maps

par(mar=c(0,0,0,0)) # background map
map(‘world’,col=”#262626″, fill=TRUE, bg=”white”, lwd=0.05,mar=rep(0,4),border=0, ylim=c(-80,80) ) # other cols = #262626; #f2f2f2; #727272
for(i in 1:nrow(citydf3)){
plot_my_connection(citydf3$Deplong[i], citydf3$Deplat[i], citydf3$Arrlong[i], citydf3$Arrlat[i],
col=”gold”, lwd=1)
} # add every connections:
points(x=citydf$long, y=citydf$lat, col=”blue”, cex=1, pch=20) # add points and names of cities
text(citydf$city_or_area, x=citydf$long, y=citydf$lat, col=”blue”, cex=0.7, pos=2) # plot city names

As always, the code files are available on the Projects Page. Happy Coding!

Call to Action:

If you read this far and also want a job or promotion in the DataScience field, then please do take a look at my new book “Data Science Jobs“. It will teach you how to optimize your profile to land great jobs with high salary; 100+ interview Qs and niche job sites which everybody else overlooks.

Email Automation for Google Trends

This blogpost will teach you set up automated email reports to view how search volumes i.e. Google Trends vary over time.

Email automation for Google Trends over time

The email report will also include important search terms that are “rising” or near a “breakout point”. This can be really useful as the breakout keywords indicate users across the globe have recently started paying great attention to these search terms. So you could create original content to attract people using these phrases in their Google searches. This is an amazing way to boost traffic/ sales leads, etc. by taking advantage of new trends.

Note, that the results are relative, not absolute search volume terms. But it is still quite useful, as you could narrow down your keywords list, and login to Adsense/ keyword planner to get the exact search volume. Export the list from this script to a .csv and simply upload in Adsense. It also gives you a clear indication of how search volumes compare across similar terms – classic SEO !

We will perform all our data pull requests and manipulations in R. The best part is that you do not need any API keys or logins for this tutorial!

[ Do you know what else is trending? My book on how to get hired as a datascientist. Check it out on Amazon, where it is the #1 NEW RELEASE and top 10 in its categories. Whether you are currently enrolled in a data science course or actively job searching, this book is sure to help you attract multiple job offers in this lucrative niche. ]

Without further interruptions – let’s dive right in to the trend analysis.

Step 1 – Load Libraries

Start by loading the libraries – “gtrends” is the main library package which will help us pull data for search results.

library (gtrendsR)
library(ggplot2)
library(plotly)
library(dplyr)
library(sqldf)
library(reshape2)

Step 2 – Search terms and timeframe

We need to specify the variables we need to pass to the search query:

  • search terms of interest. Unfortunately, you can only pass 5 terms at one time. Theoretically you could store the value and repeat the searches, but since numbers are relative, make sure that you keep at least one term in common and then normalize.
  • Remember, we get relative search volumes (max = 100); NOT absolute volumes!
  • timeframe under consideration, has to be in the format “YYYY-mm-dd” ONLY. No exceptions. End date = today, whereas start date will be the the first of the month, six months ago.
  • country codes – I’ve only used “US”, but you can search for multiple countries using a string array like c(“US”, “CA”, “DE”) which stands for US, Canada and Germany.
  • Channels – default is “web”, but you can search for “new” or “images”. Images would be good for those promoting content in Pinterest or Instagram.

date6mthpast <- Sys.Date() – 180
startdate <- paste0( substr(as.character(date6mthpast), 1,7), “-01”, sep = “”)
currdate = as.character(Sys.Date())
timeframe = paste( startdate, currdate)
keywords <- c(“Data Science jobs”, “MS Analytics Jobs”, “Analytics jobs”,
“Data Scientist course”, “job search”)
country=c(‘US’)
channel=’web’

We will use the gtrends() function to pull the data. This function returns a list of variables and dataframes. Of main interest to us is the “interest_over_time” data frame, “interest_by_region” (state names mostly). There is also a dataframe named “interest_by_city”. The first one does hold data with date value, while the others do not, so it will be aggregated over the entire data frame. I worked around this by pulling once for 6 months, and again for the last 45 days.

trends = gtrends(keywords, gprop =channel,geo=country, time = timeframe )

Step 3 – Search Volume over time

We will use the ggplot function to get a graphical representation of the search volume.

ggplot(data=time_trend, aes(x=date, y=hitval, group=keyword, col=keyword))+
geom_line()+xlab(‘Time’)+ylab(‘Relative Interest’)+ theme_bw() +
theme(legend.title = element_blank(), legend.position=”bottom”, legend.text=element_text(size=12)) +
ggtitle(“Google Search Volume over time”)

Google search volume over time
Google trends over time

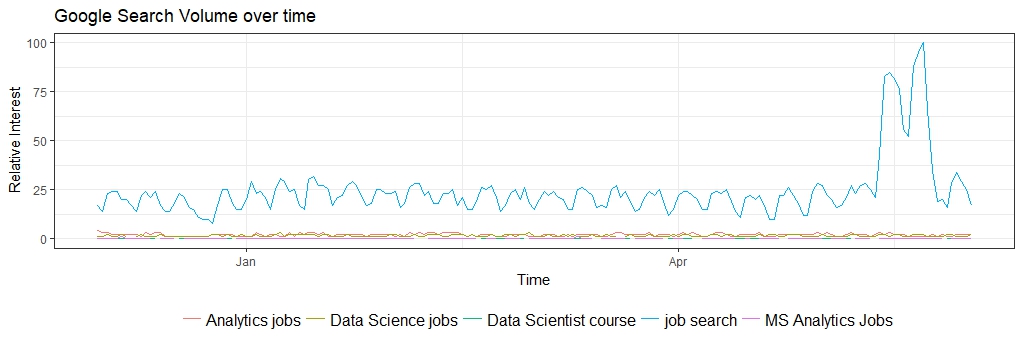
Notice that the interest in term “job search” is significantly higher than any other keyword and spike in April and May (people graduating maybe?) This makes sense as it is a more generic term, and applies to larger number of users. On a similar vein, look at the volumes for “MS analytics jobs” . It is almost nil, so clearly a non-starter in terms of targeting.

Step 4 – Interest by Regions

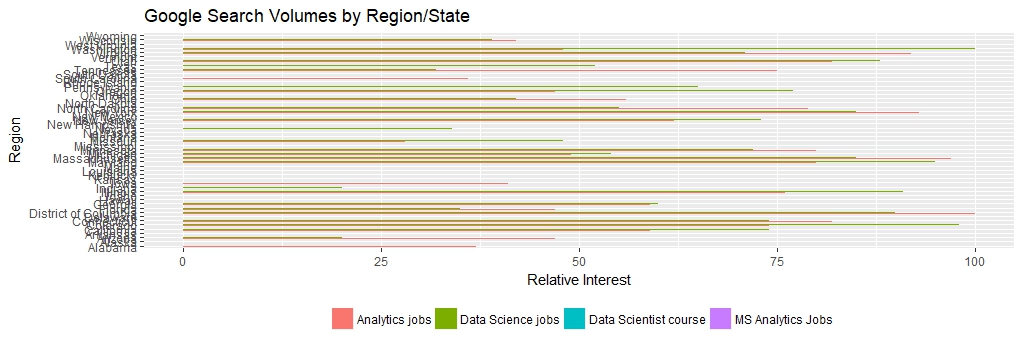
Let us look at interest by region (state names in the US ) . This might be useful to target folks by region, or even location-based ads.

locsearch = trends$interest_by_region
plot2 <- ggplot(subset(locsearch, locsearch$keyword != “job search”),
aes(x=as.factor(location), y= hits, fill=as.factor(keyword) )) +
geom_bar(position=”dodge”, stat=”identity”) +
coord_flip() +
theme(legend.title = element_blank(), legend.position=”bottom”, legend.text=element_text(size=9)) +
xlab(‘Region’)+ ylab(‘Relative Interest’) +
ggtitle(“Google Search Volumes by Region/State”)

Note, that “data scientist course” has almost zero interest compared to broader terms like “analytics jobs” or “datascience Jobs”. Interestingly, “analytics jobs” seems to be a preferred term over “data science” only in NY, MA and Washington DC.

Step 5 – Trending Terms

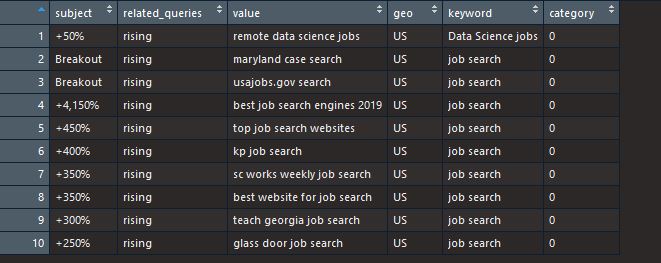
The original list also returns a dataframe titled “related_queries”. Some of these can have tags as “rising” or “breakout”. These are the terms we would like to know as they occur.

breakoutdf = reltopicdf[reltopicdf$related_queries == ‘rising’,]
volbrkdf = breakoutdf[1:10,]
row.names(volbrkdf) = NULL
volbrkdf

trending seach terms related to keywords of interest

Step 6 – Create pdf for email attachments

We will use the pdf() command to create an attachment with all the graphs and add to the email we want to send/receive on a daily basis.

filename2 = paste0(“Google Search Trends – “, Sys.Date(), “.pdf”)
pdf(paste0(“Google Search Trends – “, Sys.Date(), “.pdf”))
plot1
plot2
print(volbrkdf)
dev.off()
dev.off()

If you want to embed one of these figures in the email itself, instead of attachment then please see my post on automated reports.

Step 7 – Send the email

We use the RDCOM library to send out emails. You do need to have Outlook mail client on your PC.

library(RDCOMClient)
OutApp <- COMCreate(“Outlook.Application”)
outMail = OutApp$CreateItem(0)
outMail[[“To”]] = “an**@gmail.com”
outMail[[“subject”]] = paste(“Google Search Trend Report -“, Sys.Date())
email_body1 <- “Write email body content with correct html tags”
outMail[[“HTMLBody”]] = email_body1
file_location = paste0(paste0(abs_path,”/”),filename2)
outMail[[“Attachments”]]$Add(file_location)
outMail
outMail$Send()

The first time you run this, you might need to “allow” RStudio to access your email account. Just add this script to a task scheduler, and choose frequency of delivery, and you are all set! Note, a dummy email address is used, so remember to change the recipient address.

Try it out and let me know if you have any questions, or run into errors. The script is available on the Projects page – link here

Last but not the least, if you are interested in getting hired in a data science field, then please do take at my job-search book. Here is the Amazon link.

Happy Coding!

How to Become a Data Scientist

This question and its variations are the most searched topics on Google. As a practicing datascience professional, and manager to boot, dozens of people ask me this question every week.

This post is my honest and detailed answer.

Step 1 – Coding & ML skills

  • You need to master programming in either R or Python. If you don’t know which to pick, pick R, or toss a coin. [Or listen to me, and pick R – programming as it is used at Top Firms like NASDAQ, JPMorgan, and many more..] Also, when I say master, you need to know more than writing a simple calculator or “Hello World” function. You should be able to perform complex data wrangling, pull data from databases, write custom functions and apply algorithms, even if someone wakes you up at midnight.
  • By ML, I mean the logic behind machine learning algorithms. When presented with a problem, you should be able to identify which algorithm to apply and write the code snippet to do this.
  • Resources – Coursera, Udacity, Udemy. There are countless others, but these 3 are my favorites. Personal recommendation, basic R from Coursera (JHU) and Machine learning fundamentals from Kirill’s course on Udemy.

Step 2 – Build your portfolio.

  • Recruiters and hiring managers don’t know you exist, and having an online portfolio is the best way to attract their attention. Also, once employers do come calling, they will want to evaluate your technical expertise, so a portfolio helps.
  • The best way to showcase your value to potential employers is to establish your brand via projects on Github, LinkedIn and your website.
  • If you do not have your own website, create one for free using wordpress or Wix.
  • Stumped on what to post in your project portfolio?
  • Step1 – Start by looking in the kernels portion on the site www.kaggle.com there are tons of folks who have leveraged free datasets to create interesting visualizations. Also enroll in any active competitions and navigate to the discussion forums. You will find very generous folks who have posted starter scripts and detailed exploratory analysis. Fork the script and try to replicate the solution. My personal recommendation would be to begin with titanic contest or the housing prices set. My professional website journeyofanalytics also houses some interesting project tutorials, if you want to take a look.
  • Step 2 – pick a similar datasets from kaggle or any other open source site, and apply the code to the new datasets. Bingo, a totally new project and ample practice for you.
  • Step3 – Work your way up to image recognition and text processing.

Step 3 – Apply for jobs strategically.

  • Please don’t randomly apply to every single datascience job in the country. Be strategic using LinkedIn to reach out to hiring managers. Remember, its better to hear “NO” directly from the hiring manager than to apply online and wait in eternity.
  • Competition is getting fierce, so be methodical. Books like “Data Science Jobs” will help you pinpoint the best jobs in your target city, and also connect with hiring managers for jobs that are not posted anywhere else.
  • Yes, I wrote the book listed above – this is the book I wished I had when I started in this field! Unlike other books on the market with random generalizations, this book is written specifically for jobseekers in the datascience field. Plus, I’ve successfully helped a dozen folks land lucrative jobs (data analyst/data scientist roles) using the strategies outlined in this book. This book will help you cut your datascience job search time in half!
  • Upwork is a fabulous site to get gigs to tide you until you get hired full-time. It is also a fabulous way of being unique and standing out to potential employers! As a recruiter once told me, “it is easier to hire someone who already has a job, than to evaluate someone who doesn’t!”
  • If your first job is not at your dream job, do not despair. Earn and learn, every company, big or small, will teach you valuable skills that will help you get better and snag your ideal role next year. I do recommend staying at roles for at least 12 months, before switching, otherwise you won’t have anything impactful to discuss in the next interview.

Step 4 – Continuous learning.

  • Even if you’ve landed the “data scientist” job you always wanted, you cannot afford to rest on your laurels. Keep your skills current by attending online classes, conferences and reading up on tech changes.
    Udemy, again is my go to resource to stay abreast of technical skills.
  • Network with others to know how roles are changing, and what skills are valuable.

Finally, being in this filed is a rewarding experience, and also quite lucrative. However, no one can get to the top without putting in sufficient effort and time. So, master the basics and apply your skills, you will definitely meet with success.

If you are looking to establish a career in datascience, then don’t forget to take a look at my book – “Data Science Jobs‘ now available on Amazon.