Introduction
Today’s post is a 2-part tutorial series on how to create an interactive ShinyR application that displays sentiment analysis for various phrases and search terms. The application accepts user a search term as input and graphically displays sentiment analysis.
In keeping with this month’s theme – “API programming”, this project uses the Twitter API to perform real-time search for tweets containing the user input term. Live App Link on Shiny website is provided and screenshot is as follows:

Shiny application for Twitter Sentiment Analysis
The project idea may seem simple at first, but will teach you the following skills:
- working with Twitter API and dynamic data streaming (every time the search term changes, the program sends a new request to Twitter for relevant tweets),
- Building an “interactive”, real-time application in Shiny/R,
- data visualization with R
As always, the entire source code is also available for download on the Projects Page or can be forked from my Github account here.
The tutorial is divided into 3 parts :
Application Design:
Any good software project begins with the design first. For this application, the design flowchart is shown below:
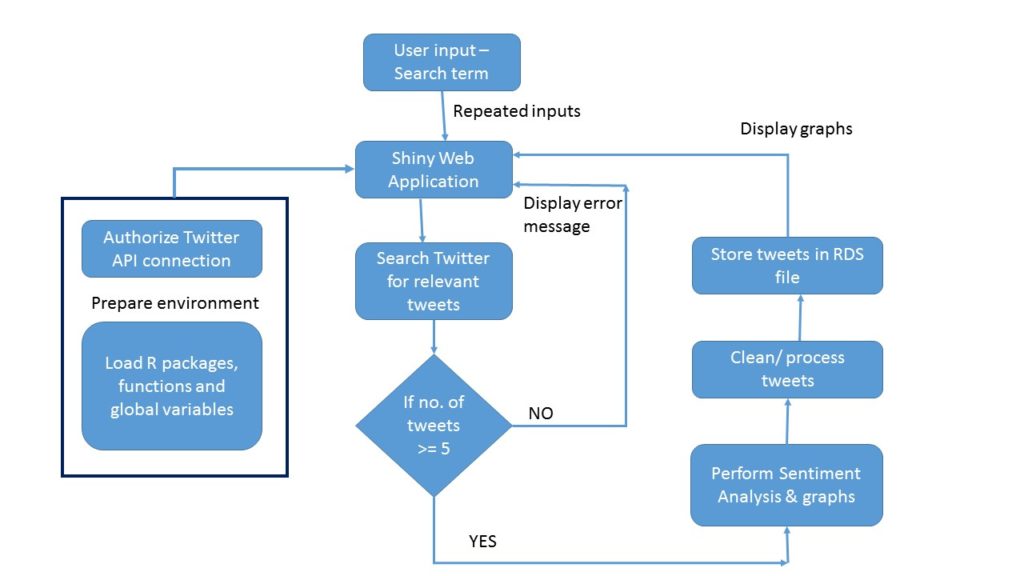
Design Flowchart for Shiny app
Twitter Connectivity
This is similar to the August project and mainly consists of two calls to the Twitter API:
- authorize twitter api to mine data, using setup_twitter_oauth() function and your Twitter developer keys.
library(twitteR)
consumer_key = “ckey”
consumer_secret = “csecret”
access_token = “atoken”
access_secret = “asecret”
setup_twitter_oauth(consumer_key, consumer_secret, access_token, access_secret)
- check whether the input search term returns tweets containing the phrase. If number of tweets <=5 return an error message. If number of tweets >5, process the tweets and display a sentiment analysis barchart. A custom function performs this computation
chk_searchterm <- function( term )
{ tw_search = searchTwitter(term, n=20, since=’2013-01-01′)
# look for all tweets containing this search term.
if(length(tw_search) <= 5)
{ return_term <- “None/few tweets to analyse for this search term. Please try again!” }
else
{ return_term <- paste(“Extracting max 20 tweets for Input =”, term, “.Sentiment graph below “) }
return(return_term)
}
The bargraph is created by assigning numeric values for each of the positive and negative emotions using the tweet text. Emotions used – anger, anticipation, disgust, joy, sadness, surprise, trust, overall positive and negative sentiment.
Shiny webapp
The actual Shiny application design and twitter connectivity are explained in the next post.
