Deep dive into data analysis tools, theory and projects

Tag: text analysis

Who wants to work at Google?

In this tutorial, we will explore the open roles at Google, and try to see what common attributes Google is looking for, in future employees.


This dataset comes from the Kaggle site, and contains text information about job location, title, department, minimum and preferred qualifications and the responsibilities of the position. Using this dataset we will try to answer the following questions: You can download the dataset here, and run the code on the Kaggle site itself here.

  1. Where are the open roles?
  2. Which departments have the most openings?
  3. What are the minimum and preferred educational qualifications needed to get hired at Google?
  4. How much experience is needed?
  5. What categories of roles are the most in demand?

Data Preparation and Cleaning:

The data is all in free-form text, so we do need to do a fair amount of cleanup to remove non-alphanumeric characters. Some of the job locations have special characters too, so we remove those using basic string manipulation functions. Once we read in the file, this is the snapshot of the resulting dataframe:

Job Categories:

First we look at which departments have the most number of open roles. Surprisingly, there are more roles open for the “Marketing and Communications” and “Sales & Account Management” categories, as compared to the traditional technical business units. (like Software Engineering or networking) .

Full-time versus internships:

Let us see how many roles are full-time and how many are for students. As expected, only ~13% of roles are for students i.e. internships. Majority are full-time positions.

Technical Roles:

Since Google is predominantly technical company, let us see how many positions need technical skills, irrespective of the business unit (job category)

a) Roles related to “Google Cloud”:

To check this, we investigate how many roles have the phrase either in the job title or the responsibilities. As shown in the graph below, ~20% of the roles are related to Cloud infrastructure, clearly showing that Google is making Cloud services a high priority.

Educational Qualifications:

Here we are basically parsing the “min_qual” and “pref_qual” columns to see the minimum qualifications needed for the role. If we only take the minimum qualifications into consideration, we see that 80% of the roles explicitly ask for a bachelors degree. Less than 5% of roles ask for a masters or PhD.
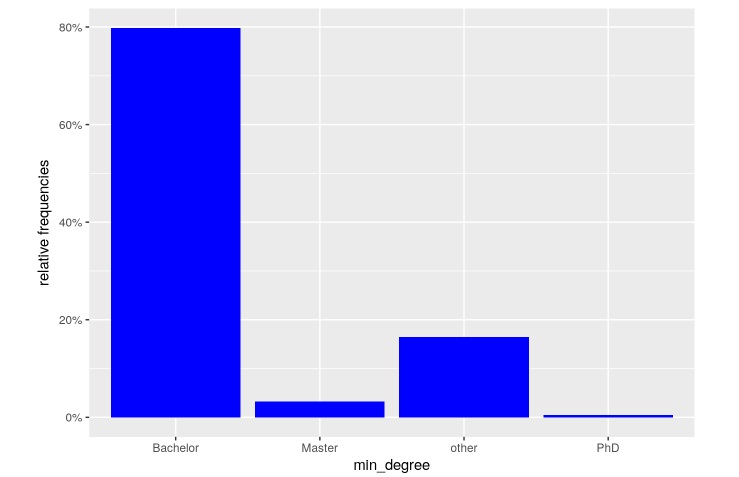
min_qualifications for Google jobs

However, when we consider the “preferred” qualifications, the ratio increases to a whopping ~25%. Thus, a fourth of all roles would be more suited to candidates with masters degrees and above.

Google Engineers:

Google is famous for hiring engineers for all types of roles. So we will read the job qualification requirements to identify what percentage of roles requires a technical degree or degree in Engineering.
As seen from the data, 35% specifically ask for an Engineering or computer science degree, including roles in marketing and non-engineering departments.

Years of Experience:

We see that 30% of the roles require at least 5-years, while 35% of roles need even more experience.
So if you did not get hired at Google after graduation, no worries. You have a better chance after gaining a strong experience in other companies.

Role Locations:

The dataset does not have the geographical coordinates for mapping. However, this is easily overcome by using the geocode() function and the amazing Rworldmap package. We are only plotting the locations, so some places would have more roles than others.  So, we see open roles in all parts of the world. However, the maximum positions are in US, followed by UK, and then Europe as a whole.

Responsibilities – Word Cloud:

Let us create a word cloud to see what skills are most needed for the Cloud engineering roles: We see that words like “partner”, “custom solutions”, “cloud”, strategy“,”experience” are more frequent than any specific technical skills. This shows that the Google cloud roles are best filled by senior resources where leadership and business skills become more significant than expertise in a specific technology.


Conclusion:

So who has the best chance of getting hired at Google?

For most of the roles (from this dataset), a candidate with the following traits has the best chance of getting hired:

  1. 5+ years of experience.
  2. Engineering or Computer Science bachelor’s degree.
  3. Masters degree or higher.
  4. Working in the US.

The code for this script and graphs are available here on the Kaggle website. If you liked it, don’t forget to upvote the script. 🙂

Thanks and happy coding!

Password Strength Analysis – a Tutorial on Text Analysis & String Manipulation

In this post we will learn how to apply our data science skills to solve a business problem – namely why passwords get stolen or hijacked?
This post is inspired from a blog entry on Data Science Central, where the solution was coded in Python. (Our analysis will use R programming and extend the original idea)

In this tutorial, we will explore the following questions:

  1. What are the most common patterns found in passwords?
  2. How many passwords are  banking type “strong ” combinations (containing special characters, length >8) ?
  3. How many passwords make excessive use of repetitive characters, like “1111”, “007”, “aaabbbccc” or similar.


Remember, this is a “real-world” dataset and this type of list is often used to create password dictionaries. You can also use it to develop your own password strength checker.


Overall, this tutorial will cover the following topics:

  1. basic string functions: stringlength, stringsearch, etc.
  2. data visualization using pie charts, histograms,
  3. Color coded HTML tables (similar to Excel) – a great feature if you plan to create Shiny Webapps with Tables.
  4. Weighted ranking.


So let’s get started:


What makes a “Strong” password?

First let us take a look at the minimum requirements of  an ideal password:

  1. Minimum 8 characters in length.
  2. Contains 3 out of 4 of the following items:
    • Uppercase Letters
    • Lowercase Letters
    • Numbers
    • Symbols


Analysis Procedure:


  1. Load input (password data) file:

TFscores = data.frame(fread(“C:/anu/ja/dec2016/passwords_data.txt”, stringsAsFactors = FALSE, sep = ‘\n’, skip = 16))


2. Calculate length of each password:

TFscores$len = str_length(TFscores$password)


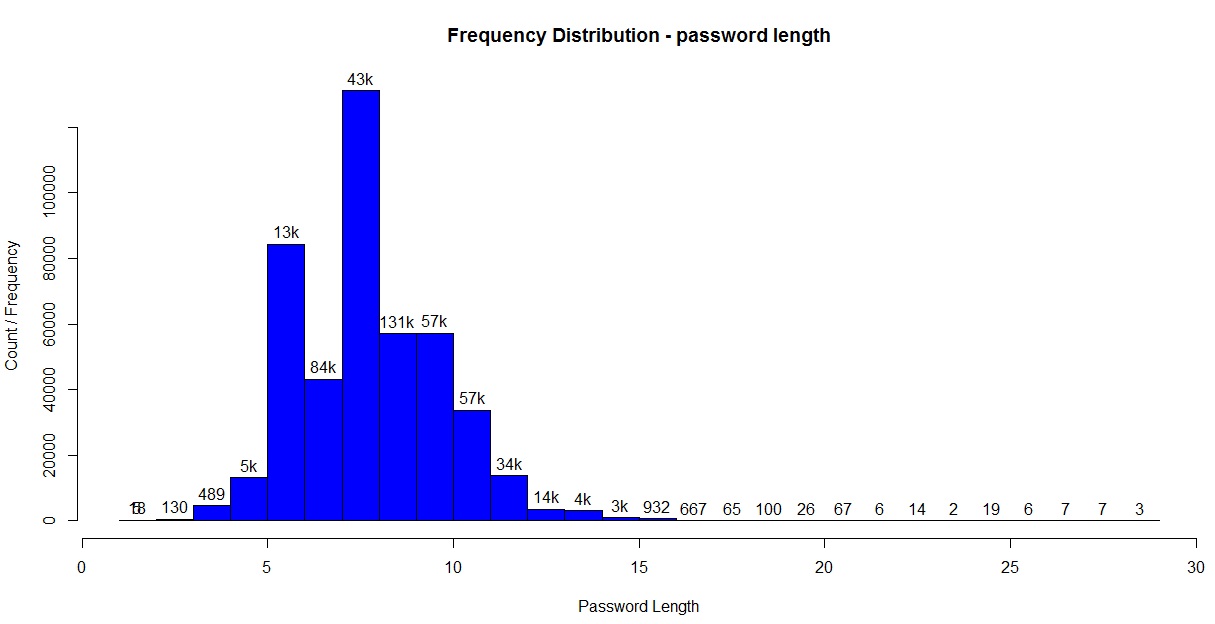
3. Plot histogram to see frequency distribution of password lengths. Note, we use a custom for-loop to generate labels for the histogram.

hist(TFscores$len, col = “blue” , ylim = c(0, 150000),

main = “Frequency Distribution – password length”,

xlab = “Password Length”,  ylab = “Count / Frequency”, labels = lendf$labelstr)

Histogram for password lengths

Histogram for password lengths


4.

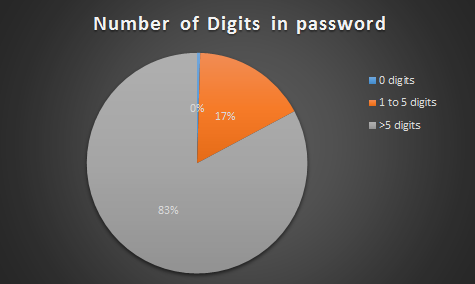
a. Calculate number of digits in each password.

number of digits in password

number of digits in password

TFscores$strmatch = gsub(pattern = “[[:digit:]]”, replacement = “”, TFscores$password)

TFscores$numberlen = TFscores$len – str_length(TFscores$strmatch)

b. Similarly calculate number of characters from other character classes:

  • Upper case alphabets
  • Lower case alphabets
  • Special characters – ! ” # % & ’ ( ) * + , – . / : ;


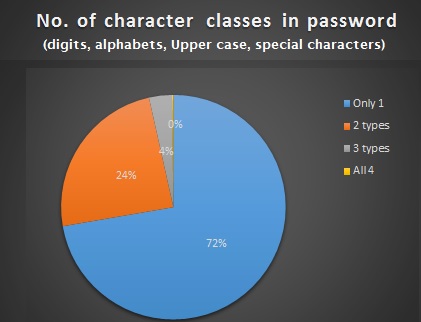
5. Assign 1 point as password strength “rank” for every character class present in the password.  As mentioned earlier, an ideal password should have at least 3 character classes.

TFscores$rank = TFscores$urank + TFscores$lrank + TFscores$nrank +   TFscores$srank

Let us take a look to see how the passwords in our list stack up:

pie(piedfchar$Var1,labels = labelarrchar , col=rainbow(9),  main=”no. of Character classes in password”)


password strength analysis

password strength analysis

6. Count number of unique characters in password :


Note, this function is resource intensive, and takes couple of hours to complete due to size of the dataset.
To reduce the time/effort , the calculated values are added to the zipfolder, titled “pwd_scores.csv”.

 length(unique(strsplit(tempx$password, “”)[[1]]))


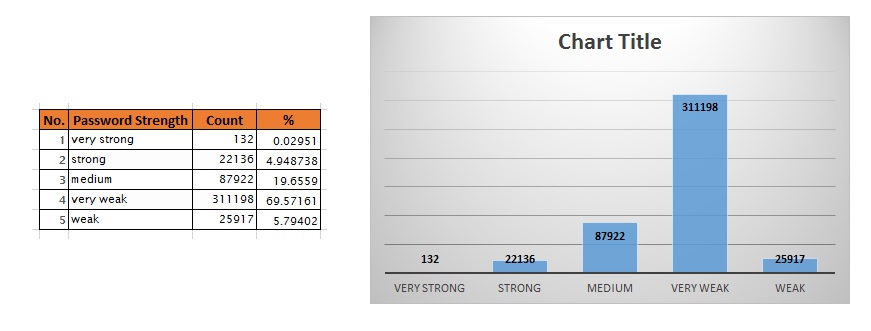
7. Assign  password strength category based on rank and length:

TFscores$pwdclass = “weak”   #default

TFscores$pwdclass[TFscores$len < 5 | TFscores$rank == 1 ] = “very weak”

TFscores$pwdclass[TFscores$len >= 8 & TFscores$rank >=2] = “medium”

TFscores$pwdclass[TFscores$len >= 12] = “strong”

TFscores$pwdclass[TFscores$len >= 12 & TFscores$rank == 4] = “very strong”

Based on this criteria, we get the following frequency distribution:

password strength

password strength

7. We can derive the following insights from steps 5 and 6:

  • 77.68% of passwords are weak or very weak!
  • ~3% of passwords have less than 5 characters.
  • ~72% of passwords have less only 1 type of character class.
  • 0.5% of passwords have 8+ characters yet number of unique characters is less than 30%.
  • ~0.9% of characters have less than 4 unique characters.
  • 72% of passwords contain only digits.

8. Let’s see if there are any patterns repeated in the passwords, like “12345”, “abcde”, “1111”, etc:

TFscores$strmatch = regexpr(“12345”, TFscores$password)

pwd with years

password with year prefixes.

  • 1.2% of passwords contain pattern “12345”.
  • 0.01% of passwords contain pattern “abcde”.
  • 0.3% of passwords contain pattern “1111”.
  • 0.02% of passwords contain pattern “1234”.
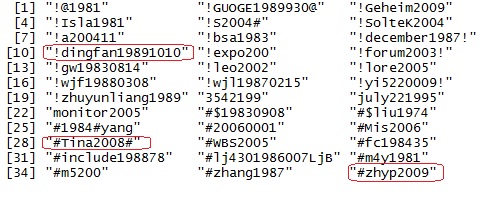
  • 15% of passwords contain year notations like “198*”, “197*”, “199”, “200*”. Sample shown alongside clearly shows that many people use important years from their life for their passwords. (logically true!)


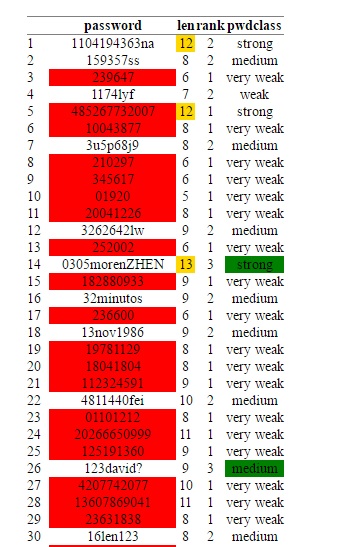
9. View the password strength visually. We use the “condformat” function to create an HTML table that is easy to assimilate:

condformat(testsampledf) +  rule_fill_discrete(password, expression = rank < 2, colours = c(“TRUE”=”red”)) +
rule_fill_discrete(len, expression = (len >= 12), colours = c(“TRUE”=”gold”)) +
rule_fill_discrete(pwdclass, expression = (rank>2 & len>=8) , colours = c(“TRUE”=”green”))

password strength HTMl table

password strength HTMl table

Twitter
Visit Us
Follow Me
LinkedIn