Hello All,
First of all, Happy New Year! Wishing you all a fantastic year in 2017 and hope you achieve all your goals for this year, and much more! 🙂
Most people’s New Year Resolutions are related to health, whether it going to the gym, eating healthy, walking more, reducing that stubborn belly fat or something similar. Since I bought a Fitbit Charge2 fitness tracker late this year, I thought it would be an interesting idea to base this month’s project on the data.
The entire codebase, images and datafiles are available at this link on a new Projects Page.
Project Overview:
The project consists of 3 parts:
- Scraping the Fitbit Site: for “sleep quality” data. If you log in to the Fitbit site, they do allow export of exercise, sleep duration and some other data. However, crucial data like heartrate during activities, number of movements during the night, duration of restless sleep, etc are completely missing! I realize not everyone has a Fitbit, so I’ve added some datafiles for you to experiment. However, you can use the logic to scrape other sites in a similar fashion since I am using my login credentials. (similar to API programming explained in these posts on Twitter and Yelp API)
- Aggregating downloaded data: We also download data freely available on the website itself and then aggregate them together , selecting only the data we want. This step is important because in the real-world, data is rarely found in a single repository. Data cleansing, derived variables and other processing steps will happen in this section.
- Hypothesis testing: In this part, we will try to understand what factors affect sleep quality. Does it depend on movements during the night, is there better sleep on weekend nights, etc.? Does exercising more increase sleep quality?
Section 1:
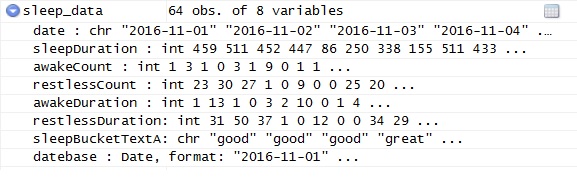
Scraping the Fitbit site was made extremely easy thanks to the package “fitbitScraper”. In our program file “fitbit_scraper.R”, we extract sleep related data for the month of Nov and Dec 2016.
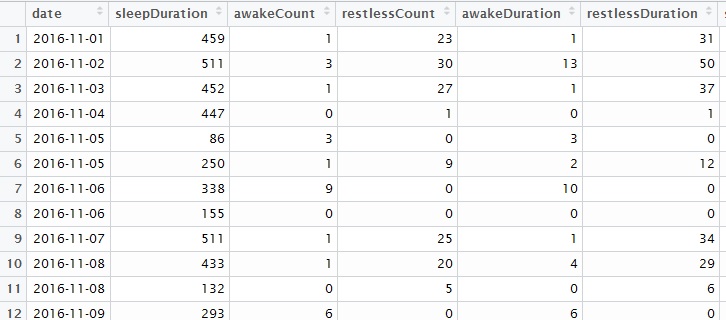
sleep_datafile
Section 2:
We combine the data from the web scraper, heartrate and exercise datafiles. We now have data for 2 months regarding the following variables:
- sleep duration / start/ end time, sleep quality
- number of movements during the night, number of times awake, duration of both.
- Calories_burnt/ day, number of minutes performing light/ moderate/ heavy exercise,
- weekday, date , month.
Fitbit dataset
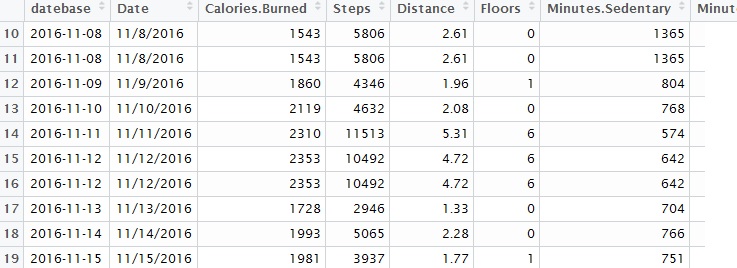
final datafile Fitbit tracker
Section 3:
Using the above data, we use hypothesis testing methods (anova, correlation and chi-square testing ) to understand patterns in our data.
Once you run the code, you will observe the following results:
- Number of times awake increase when daily steps are between 4000-7000 steps.
- Weekends do NOT equate to better sleep, even though duration of sleep is higher.
- Sleep quality is WORST when number of movements is <10 during the night. This may seem counter-intuitive, but I know from personal experience that on the days when I am stressed out, I sleep like a robot in one position throughout the night. The data seems to support this theory as well. 🙂
- Number of calories burnt is highest during weekends (unsurprising), followed by Tuesday.
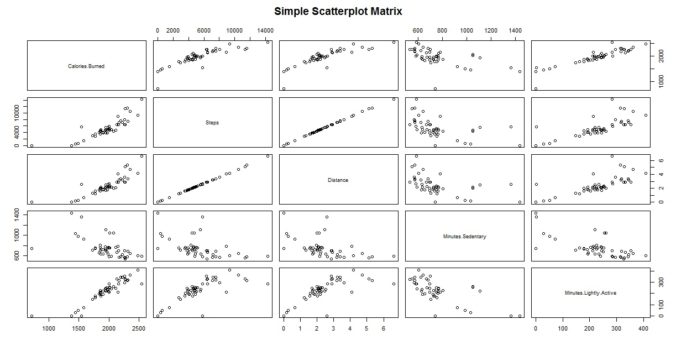
Apart from the statistical tests, we also use data visualizations to double-check our analysis. Some plots are given below:
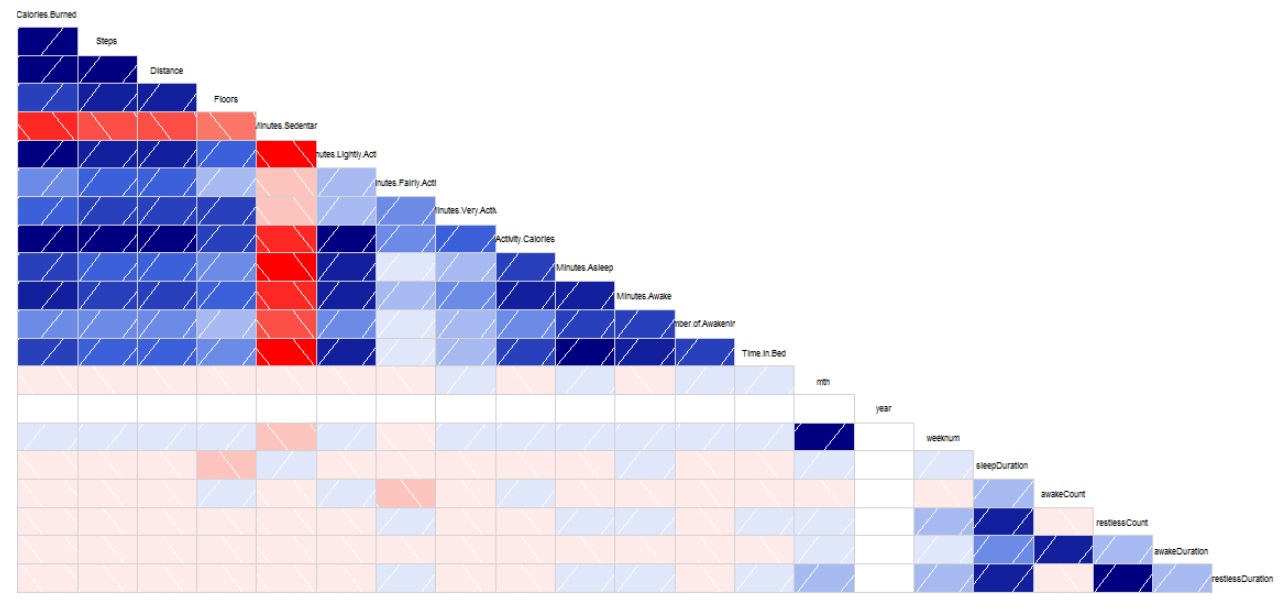
correlation diagram
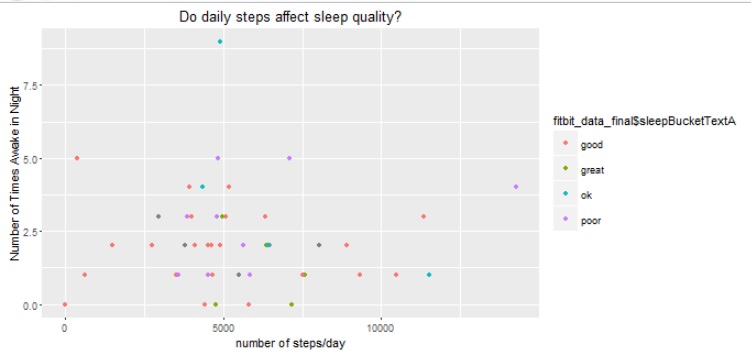
steps versus sleep_quality
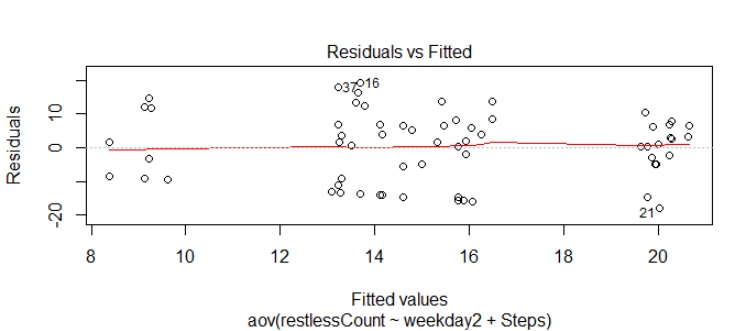
anova
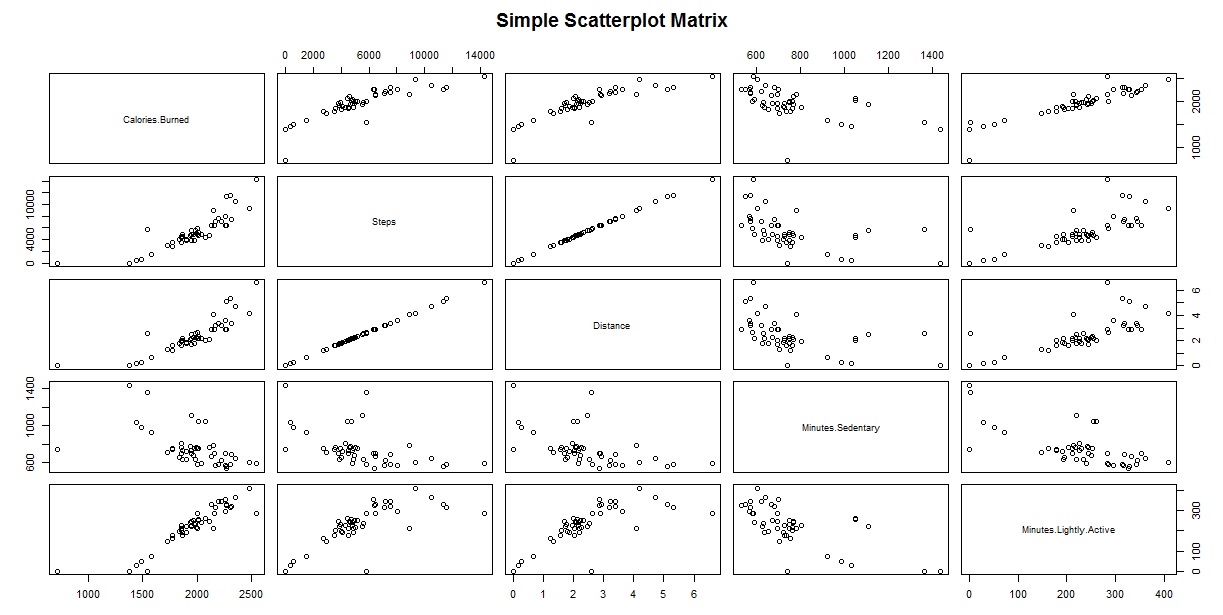
diagram to view relationships between variables
Once again, feel free to download the code and play with the data. Share your thoughts and experiences in the comments section.
Until next time, adieu!
